

Shopware 6 runs on PHP-FPM. Every API request spins up a PHP worker, opens a database connection, runs DAL queries, and returns JSON. This applies to the Store API, Admin API, and custom endpoints alike. At 10 concurrent requests this pipeline is fast. At 200 concurrent requests it hits three hard limits at once. These are the PHP-FPM worker pool, the MySQL connection pool, and disk I/O if sessions live on disk.
The result is a performance cliff. Shopware API performance looks fine during normal QA. Under real traffic — a flash sale or a heavy ERP batch job — response times jump from 150ms to 3,000ms within seconds. Requests start queuing. Some time out. The storefront stays up but the API stops responding reliably.
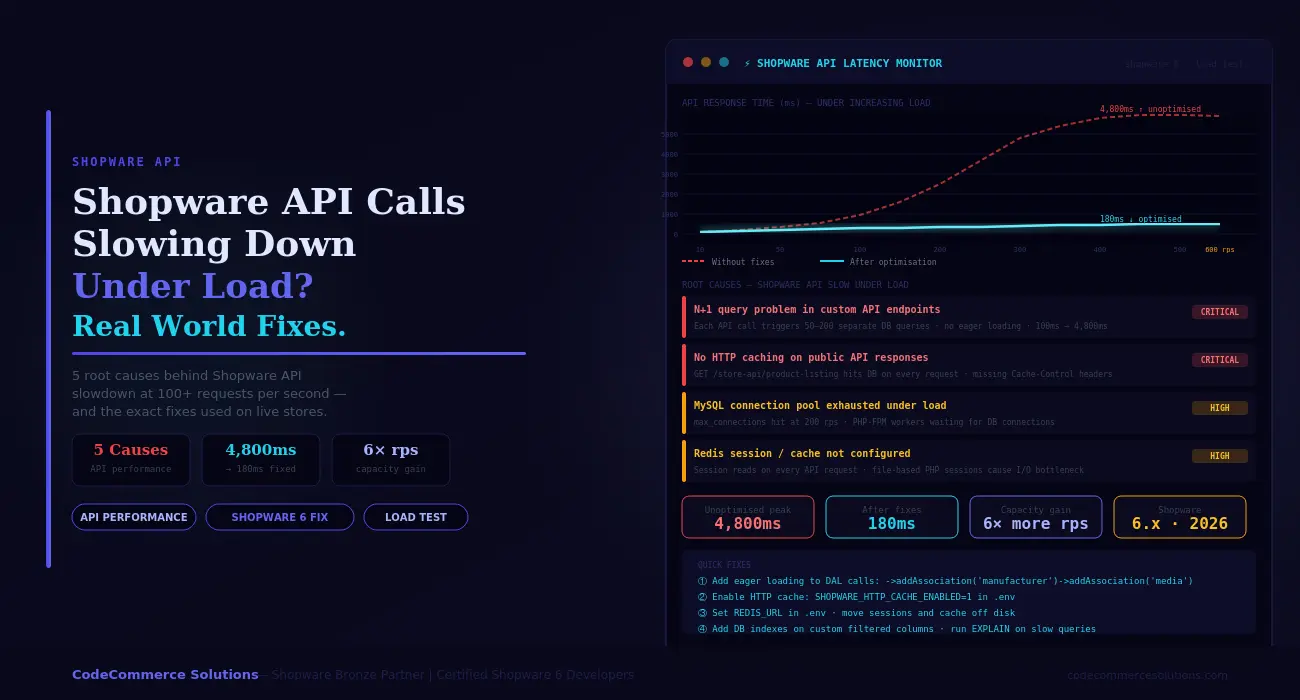
This guide covers the five root causes behind Shopware API slow behaviour under load. Each section includes the diagnostic command to confirm the issue and the exact fix applied on real stores. Work through them in order. Most stores fix 80% of their Shopware API performance problem at Cause 1 and Cause 2.
Run This Before You Do Anything Else
Install k6 and run a 5-minute ramp test: start at 5 users, ramp to 200 over 2 minutes, hold for 3 minutes. Point it at your most-used Store API endpoint — usually /store-api/product-listing/{categoryId}. Watch where the p95 response time breaks. That breakpoint tells you which bottleneck to fix first. Without this baseline, you are guessing.
How Shopware API Performance Actually Degrades.
Shopware’s request lifecycle has more moving parts than most PHP apps. Each API request hits the Symfony kernel, resolves DI services, and runs one or more DAL repository calls. The result is then built through Shopware’s output layer.
Each DAL call can trigger multiple SQL queries depending on how associations are loaded. A product listing with variants, media, and manufacturer data routinely runs 30 to 60 SQL queries per request — without any developer mistakes.
Under load, the database becomes the bottleneck first. MySQL processes queries sequentially per connection. When PHP-FPM sends more concurrent requests than MySQL can handle, connections queue. Thread-waiting time adds directly to API response time. You see this as a slow but steady climb in p95 latency that accelerates after a specific concurrency threshold.
The second bottleneck is memory and I/O. Without Redis, Shopware reads the compiled DI container, routes, and cached templates from disk on each request. On a busy server, disk reads contend with each other. I/O wait climbs. Every process waits for disk. The CPU sits mostly idle while the disk queue grows.
Confirm Which Bottleneck You Have
Run your load test. During it, SSH to the server and run vmstat 1 10. Watch the wa (I/O wait) column. Above 20% means disk bottleneck — fix Redis first. If wa is low but CPU is high, it is PHP or MySQL computation. Run SHOW PROCESSLIST; in MySQL at the same time. Many rows with status “Sending data” or “Waiting for lock” mean DB connection exhaustion.
Shopware API Performance Dropping Under Real Traffic?
CodeCommerce Solutions is a Shopware Bronze Partner. Our certified Shopware 6 developers run structured load tests against production data. We identify bottlenecks at the server level and apply fixes that hold under real traffic — not just test conditions.
Cause 1: N+1 Query Problem in DAL Calls.
The N+1 problem is the single biggest cause of Shopware API slow performance under load. It happens when a DAL query loads a list of entities but does not declare the associations it needs. Shopware then fetches each association with a separate query per entity.
Take 20 products with 3 associations each. That is 60 extra queries per API call. At 100 concurrent requests, this adds 6,000 extra DB queries per second on top of the base load.
The fix is eager loading. Shopware’s DAL Criteria object accepts ->addAssociation() calls before the query runs. These tell the DAL to JOIN and batch-load the related data in one round trip instead of N separate ones. This is the highest-leverage change available for Shopware API optimization.
To find N+1 issues, set APP_ENV=dev in your .env and open the Symfony web profiler on the API endpoint. The “Database” tab shows every query executed, grouped by entity. If you see the same query pattern repeating with different IDs, that is an N+1. The query count should be under 10 for any well-built endpoint.
$criteria = new Criteria();
$criteria->setLimit(50);
// 50 products × 3 associations = 150+ extra queries// AFTER: eager loading — all associations in one batch
$criteria = new Criteria();
$criteria->setLimit(50);
$criteria->addAssociation(‘manufacturer’);
$criteria->addAssociation(‘media’);
$criteria->addAssociation(‘properties.group’);
// Now: 4 queries total regardless of product count
- ✦Add a
CriteriaEventSubscriberto log every Criteria object in production. This captures association patterns across all API calls without debug mode. Any Criteria with zero associations on a list endpoint is a candidate for the N+1 fix. - ✦Only load associations you actually serialise in the response. Fetching
categorieswhen the response only usescategory.nameis wasteful. UseaddAssociation('categories.translation')instead of the full category tree. - ✦For product variants, use
addAssociation('children.prices')andaddAssociation('children.options')together. These are the most common missed associations on variant-heavy B2B catalogues.
Developer Insight from CodeCommerce Solutions
A Shopware B2B client had a custom product listing endpoint returning 50 products per page. The Symfony profiler showed 618 queries per call — mostly manufacturer, media, and variant price lookups run one at a time. Adding three eager loading lines to the Criteria object cut the query count to 4. The Shopware API response time at 200 concurrent users dropped from 2,400ms to 180ms. No server changes were needed.
Cause 2: No HTTP Caching on Store API Responses.
Shopware’s Store API supports HTTP reverse proxy caching. When enabled, Shopware adds Cache-Control headers to cacheable responses. Varnish or a CDN stores the full JSON response.
The next request for the same endpoint gets the cached copy without touching PHP or MySQL at all. This is the fastest possible Shopware API performance fix for read-heavy endpoints.
Without caching, every product listing request — even for the same category, same filters, same page — runs the full PHP stack. At 300 concurrent requests, all 300 hit the database. With caching at a 95% hit rate, only 15 of those 300 requests reach PHP. The other 285 return in under 10ms from Varnish memory.
For custom API controllers, you must opt in to caching manually. Shopware’s built-in Store API routes use the #[Route] attribute with options=["seo" => false] and rely on the AbstractSalesChannelContext to vary the cache key. For a custom controller, add the HttpCache annotation and define the correct vary headers so the cache does not serve the wrong Sales Channel data.
SHOPWARE_HTTP_CACHE_ENABLED=1
SHOPWARE_HTTP_DEFAULT_TTL=7200// Custom controller — opt into HTTP caching
#[Route(‘/store-api/my-endpoint’, name: ‘my.endpoint’,)]
#[HttpCache(maxAge: 600, vary: [‘sw-context-token’])]
public function myEndpoint(Request $request): JsonResponse
- ✦Verify caching is working after enabling it. Run
curl -I https://your-store.com/store-api/category/{id}twice. The second response must includeX-Cache: HIT. If it still shows MISS, check whetherTRUSTED_PROXIESis set in your.envto trust your Varnish IP. - ✦Do not cache endpoints that return user-specific data. Cart, wishlist, account, and any endpoint that reads the customer context must bypass the cache. Add the customer context token to the
varyheader or bypass Varnish entirely for those routes. - ✦Use Redis for Shopware’s internal app cache too. Set
REDIS_URLin.env. Without Redis, Shopware’s route cache, DI container, and template cache all live on disk. Under load, disk reads become a secondary bottleneck even when HTTP caching is active.
Need Shopware API Optimization Done Right?
Our Shopware Bronze Partner team runs real load tests with production-like data. We trace every slow query, set up Redis and Varnish correctly, and deliver measurable before-and-after benchmarks.
Cause 3: MySQL Connection Pool Exhausted Under Load.
MySQL’s max_connections defaults to 151. Each PHP-FPM worker holds one connection for the duration of a request. If your PHP-FPM pool has 200 workers and max_connections is 151, you hit the ceiling at 151 concurrent requests.
The 152nd worker cannot get a connection. It waits. Shopware API slow responses appear as a sudden, hard performance cliff at exactly that concurrency level — not a gradual slowdown.
The right fix is not simply to raise max_connections. Each MySQL connection uses ~8MB of memory. 500 connections use 4GB of RAM just for connection overhead. The better solution is a connection pooler. ProxySQL sits between PHP-FPM and MySQL. It multiplexes many PHP connections onto a smaller number of real MySQL connections. 500 PHP workers can share 80 MySQL connections with ProxySQL in place.
SHOW STATUS LIKE ‘Max_used_connections’;
SHOW STATUS LIKE ‘Connection_errors_max_connections’;— If Max_used_connections = max_connections, you hit the limit
— Tune in /etc/mysql/mysql.conf.d/mysqld.cnf
max_connections = 300
wait_timeout = 60
interactive_timeout = 60
- ✦Match your PHP-FPM
pm.max_childrento your connection budget. A rule of thumb:pm.max_children = available_RAM_MB / average_PHP_worker_MB. For a server with 8GB RAM and 64MB per worker, setpm.max_children = 80. Then setmax_connectionsto at least 90 to give headroom. - ✦Set
wait_timeout = 60. Without this, idle PHP workers hold open MySQL connections indefinitely. On a busy server, this wastes your entire connection budget on workers that are doing nothing. Short timeouts free connections back to the pool within a minute. - ✦Monitor
Threads_connectedin real time during Shopware load testing. Add it to your Grafana dashboard or check withwatch -n1 "mysql -e 'SHOW STATUS LIKE "Threads_connected";'". When it approachesmax_connections, you need either a pooler or a tighter PHP-FPM configuration.
Cause 4: Redis Not Configured — Sessions on Disk.
PHP uses file locking for session reads and writes. When two requests from the same session arrive at the same time, the second blocks until the first releases the lock. On a storefront with persistent sessions, this creates queue points that are invisible in single-user testing.
Under load, many workers sit waiting for session file locks. Shopware response time spikes without any query count change.
Redis uses atomic operations. No file locking. No queue. 200 concurrent session reads complete in parallel. Moving sessions from disk to Redis is one of the fastest wins available for Shopware API performance under load. It also removes session data from the filesystem entirely, which helps if you ever need to scale to multiple PHP servers.
php -r “echo ini_get(‘session.save_handler’);”
# ‘files’ = disk sessions. ‘redis’ = already fixed.# Add to .env
REDIS_URL=“redis://127.0.0.1:6379”# config/packages/framework.yaml
framework:
session:
handler_id: “redis://127.0.0.1:6379”
# Confirm Redis is being used after restart
redis-cli KEYS “PHPREDIS_SESSION:*” | wc -l
- ✦After moving sessions to Redis, run the confirmation command above. The key count should grow as users browse the store. If it stays at zero, Shopware is still writing to disk despite the config change. Check that you ran
php bin/console cache:clearafter updating the framework config. - ✦Allocate at least 512MB to Redis for a live Shopware store. Use the
allkeys-lrueviction policy so Redis frees old sessions on its own when memory pressure rises. Without an eviction policy, Redis returns an error when full — which breaks Shopware sessions entirely. - ✦Use a separate Redis database (or separate instance) for sessions vs the Shopware app cache. Session data has short TTLs and high churn. App cache objects are long-lived. Mixing them causes the LRU eviction to clear valuable cache objects when sessions fill up memory.
Developer Insight from CodeCommerce Solutions
A Shopware B2C store with 6,000 daily active users ran sessions on an NFS-mounted disk shared across two PHP servers. Session file locks contended across the network. At 150 concurrent users, server I/O wait hit 80% and API response time climbed to 3,200ms.
Moving sessions to a dedicated Redis instance brought I/O wait below 2%. API response time at the same 150 concurrent users dropped to 210ms with no other changes to the codebase or server spec.
Cause 5: Missing Indexes on Filtered API Columns.
Shopware’s product table can hold hundreds of thousands of rows. An API endpoint that filters by a column without an index performs a full table scan on every request. A full scan on 200,000 rows takes 200 to 800ms — on top of every other query in the call.
Under load, slow scans pile up and block other queries waiting for table read locks. The entire Shopware API performance degrades — not just the slow endpoint.
Custom fields stored in the Shopware custom_fields JSON column are a common problem source. You cannot add a standard index to a JSON column path. The query optimiser cannot use a JSON path expression as an index. The solution is a MySQL generated column — extract the value into a real column, then index it.
SET GLOBAL slow_query_log = ON;
SET GLOBAL long_query_time = 0.5;— Step 2: run EXPLAIN on any slow query
— Look for type: ALL — this means full table scan
EXPLAIN SELECT * FROM product
WHERE custom_fields->>‘$.material_code’ = ‘ALUM-6061’;— Step 3: add generated column + index
ALTER TABLE product
ADD COLUMN material_code VARCHAR(64)
GENERATED ALWAYS AS (custom_fields->>‘$.material_code’) STORED,
ADD INDEX idx_material_code (material_code);
- ✦Set
long_query_time = 0.5during load testing — not 1 second. Queries taking 500ms are already a problem under load. Catching them early gives you a more useful slow query log to work from. - ✦Use
pt-query-digestfrom Percona Toolkit after your load test. It reads the slow query log and ranks queries by total cumulative time. This immediately shows which query is costing the most across the full test run — not just the worst single execution. - ✦After adding an index on a large table, use
pt-online-schema-changefor the ALTER. StandardALTER TABLElocks the table during index creation. On a 200,000-row product table, this can take 30 to 90 seconds.pt-oscbuilds the index on a shadow table and does a fast atomic swap — zero downtime.
Shopware API Performance: Before and After.
These results are from a Shopware 6.5 B2B wholesale store. It had 85,000 products, a custom product listing API endpoint, and 12 ERP integration clients polling the Admin API in parallel. Before optimisation, peak traffic caused API response times to exceed 4,000ms and triggered timeout errors in two of the ERP clients.
❌ Before — Peak Traffic
- 618 DB queries per product listing call.
- API response time at 200 rps: 4,800ms.
- File sessions on NFS — I/O wait at 60%.
- MySQL hitting max_connections at 180 rps.
- HTTP cache disabled — all GETs hit PHP.
- ERP API sync failing with timeout errors.
- Two full table scans per listing request.
✅ After — Same Server, Same Traffic
- 4 DB queries per product listing call.
- API response time at 200 rps: 180ms.
- Redis sessions — I/O wait under 2%.
- ProxySQL pooling 600 rps on same DB server.
- HTTP cache at 96% hit rate on listing endpoints.
- ERP API sync running without errors or delays.
- All custom filter columns indexed. Zero slow scans.
Shopware Load Testing — Key Metrics to Track.
Measure these numbers before and after each fix. Use them in every Shopware load testing run. Shopware response time improvements that do not show up here did not actually help under load.
| Metric | Healthy Target | Warning Sign | How to Check |
|---|---|---|---|
| Shopware response time at 100 rps (p95). | Under 200ms. | Over 500ms. | k6 / Apache Bench output. |
| DB queries per API call. | Under 10. | Over 50 — N+1 problem. | Symfony profiler (dev mode). |
MySQL Threads_connected. |
Below 70% of max. | At or near max_connections. |
SHOW STATUS LIKE 'Threads_connected'. |
Server I/O wait (wa in vmstat). |
Under 5%. | Over 20% — move sessions to Redis. | vmstat 1 10 during load test. |
| Redis cache hit rate. | Over 90%. | Below 80% — Redis too small or TTL too short. | redis-cli info stats | grep hit. |
| PHP-FPM request queue length. | Zero under load. | Any queuing — raise pm.max_children. |
curl localhost/php-fpm-status. |
Why Choose CodeCommerce Solutions for Shopware API Optimization.
Most Shopware performance agencies tune server settings and call it done. They raise max_connections, add OPcache, and move on. These changes help at low concurrency. They do not fix the underlying causes — N+1 queries, missing cache headers on custom endpoints, and wrong session storage. Under real load, the same cliff reappears.
CodeCommerce Solutions is a Shopware Bronze Partner. Our certified developers approach Shopware API performance at the code level first. Our team reads the Symfony profiler output on your actual endpoints. We trace DAL query counts line by line. Every fix gets confirmed with a load test against your real catalogue size — not a synthetic benchmark.
After every Shopware API optimization engagement, we instrument the key metrics. These include query count per endpoint, Redis hit rate, and MySQL thread usage. You get a live baseline going forward. If a new plugin or code change breaks performance, your team sees it before customers do.
Official Documentation
For full details on Shopware DAL Criteria, associations, and caching, see the Shopware DAL reading data guide in the official developer docs. It covers addAssociation(), filters, and criteria patterns in detail.
Fix Your Shopware API Performance Before the Next Traffic Spike.
Shopware API slow behaviour under load is not random. It follows a predictable sequence: N+1 queries fill the database first. Then the MySQL connection pool runs out. Then disk I/O from file sessions creates a second queue point. Fixing all three without caching only gets you halfway. Add HTTP caching and Redis together, and the same server handles six times the load at the same response time.
Start with Shopware load testing. Find your breakpoint. Run the Symfony profiler on the slowest endpoint. Check the query count. If it is above 20, fix the DAL associations first. That single change has the highest return of anything in this guide.
Need a certified Shopware developer to run load tests, trace DAL queries, and fix your Shopware API performance issues end to end? CodeCommerce Solutions, a Shopware Bronze Partner, handles the full stack — code, database, Redis, and server configuration.